Data Visualization Helps Supply Chain Leader Gain a Competitive Edge
INDUSTRY
Logistics & Supply Chain
REVENUE
$10 - $50 Million
At a Glance
Interactive data visualization and analytics are popular tools for supply chain and logistics leaders. Read on to learn how Emtec Digital helped a supply chain leader in the US rapidly expand market presence by leveraging the power of data visualization.
About the Customer
The customer is one of the giants in the supply chain and logistics industry in the US. They are a diversified group comprising global customers, vendors, and several acquired companies.
Business Need
The client wanted to expand their geographical reach and started the process by acquiring smaller supply chain companies. Each acquisition came with tons of data records and respective legacy systems. With essential data points captured regularly, it took a lot of work to gain supply chain visibility using the traditional data management system. This led to delayed decision-making and impacted overall efficiency.
Also, data reporting and visualization were significant issues, as all records had to be standardized first. Few more challenges that the client faced included:
Our Solution
The primary objective of this project was to combine data from different acquired companies, entities, divisions, customers, regions, and representatives. The team at Emtec Digital strategically delivered a solution based on the MS Azure ecosystem. Our data engineers leveraged the power of BI and developed a centralized platform for data reporting and generating insights from multiple parameters, which resulted in improved decision-making.
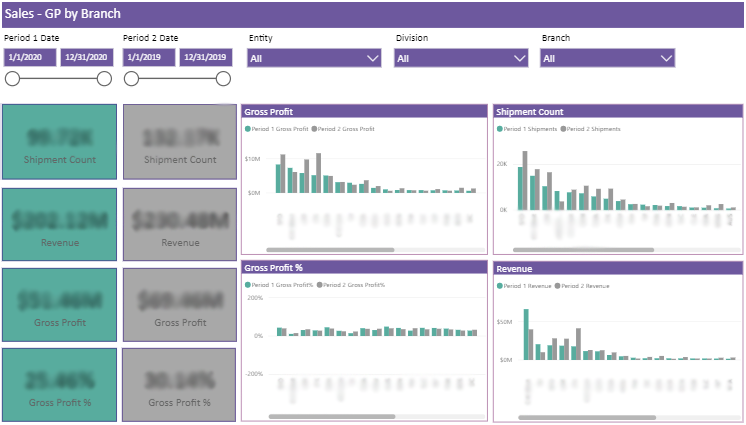
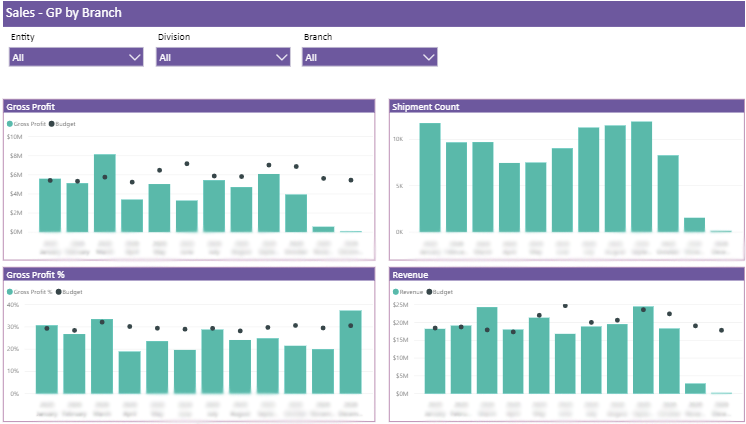
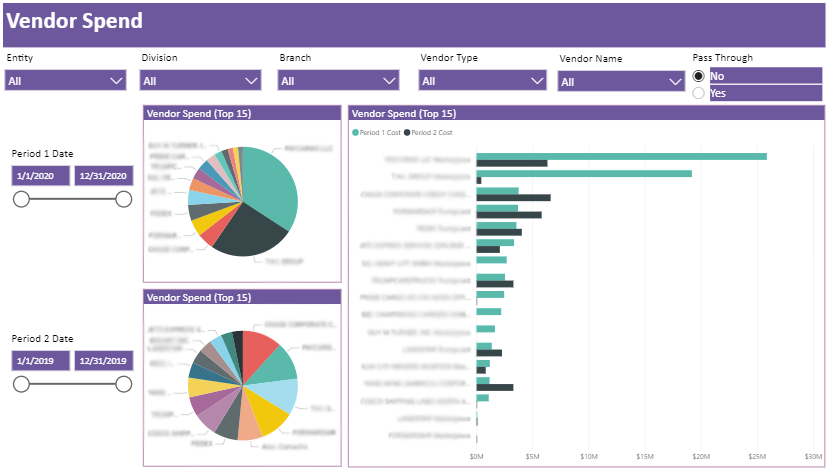
The new solution allowed enhanced data visualization, and various filters were added to support it. For example, sales reports were categorized by customer name, branch, resources, quota, etc., while other reports such as flash reports were maintained separately. This provided enhanced visibility into operational insights.
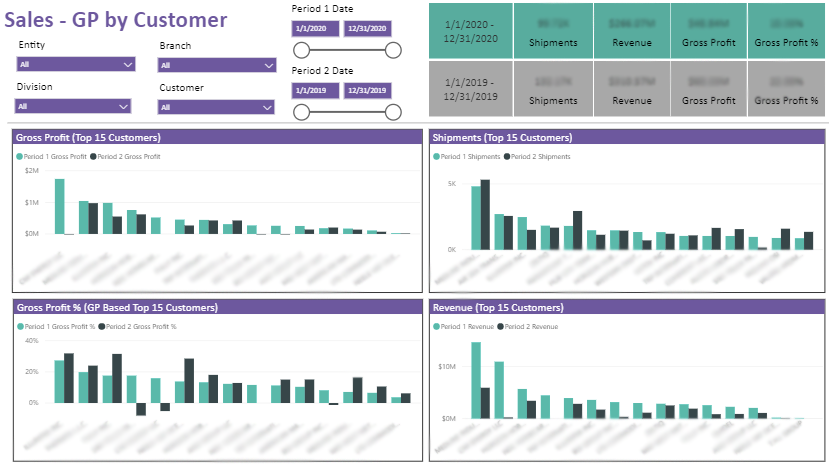
We created a single platform to monitor business processes by combining data from various sources. As a part of data aggregation, a unique ID was created to track the performances of multiple individuals and entities across the supply chain. We also leveraged some advanced Power BI features to obtain a summary of various customers, departments, sales representatives, locations and divisions, charge codes, and vendor types. A provision was made to upload external data that had to be added daily through spreadsheets. It included details of overall sales budgets and damage claims.

Unique Differentiators
Business Impact
Technologies that saved the day