Advanced Power BI Helps Global Energy Corporation Enhance Operational Efficiency
INDUSTRY
Oil & Gas
REVENUE
$20+ Billion
At a Glance
Fuels are a source of unlimited energy. Several energy companies worldwide supply fuels to diverse industries and must deal with massive data. Monitoring and analyzing energy data is crucial to understand how rapidly energy sectors are transforming in terms of market demand. Emtec Digital helped a client in the energy sector enhance operational efficiency by leveraging Power BI. Read on for more details.
About the Customer
The client is a multinational energy corporation (MEC) headquartered in the United States with a widespread global network. They supply fuel to a few of the leading airlines and power suppliers. Their operations comprise hundreds of storage terminals, 3000+ retail locations, and more than 80 airports. The numerous operational data points in their storehouses capture and accumulate enormous amounts of data.
Business Need
Energy firms come across a variety of data gathered from multiple sources. Without a robust data analytics solution, it is difficult to gather useful insights to identify key metrics and categorize patterns to quickly adapt to changing market dynamics. This was the main problem our client was facing.
A massive amount of data was generated from the client’s internal and external systems, but they needed more tools to combine, visualize, and report it. Operational difficulties resulted from tedious, time-consuming, and error-prone reporting processes. They had limited visibility into the activities at their back office and often relied on the finance, transportation, maintenance, and energy consumption divisions for more insights on operational data. Additionally, they needed advanced tools to locate, assess, and control potential hazards at energy terminals.
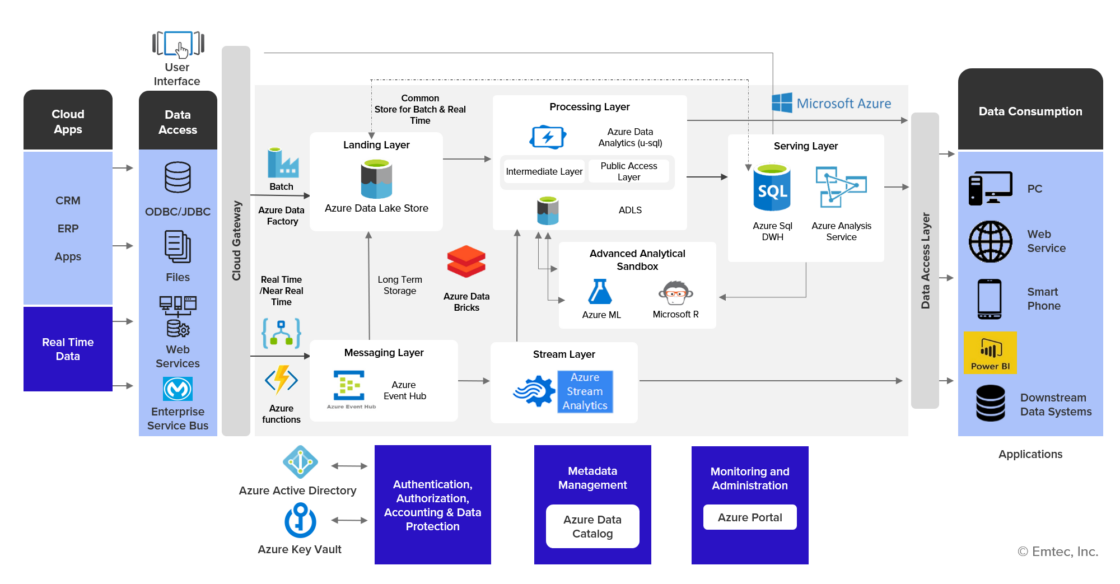
Our Solution
The Emtec Digital team analyzed the client’s need and their existing operational processes. We integrated Power BI within their existing data sources, ERP, Dynamics 365 CRM, and other internal processes. This enabled our client to evaluate data from many sources and study the amount of energy distributed over time along with usage trends through advanced digital dashboards. This allowed them to comprehend where to focus on cutting costs and boosting productivity.
Thanks to our solution, the client was able to gain actionable intelligence and quickly share reports with internal team members and other stakeholders. Power BI also allowed them to spot real-time trends and abnormalities in the process and take prompt action.
A Valuable Difference
Central Repository: To ensure that reports are generated from a single source, a centralized data collection mechanism was introduced. This resulted in 25%-30% time savings.
Data Governance: Power BI facilitated enhanced data governance, ensuring the collection of clean and valuable data in the system.
Unique Differentiators
Data Accuracy
Speed & Cost
Data Visualization and Insights
Business Impact
Technologies that saved the day